Texas Instruments Inc. (TI) is a global semiconductor company founded in 1930 and headquartered in Dallas, Texas.
Initially focused on Defense technology, TI expanded into semiconductors in the 1950s.
Today, it is a leading player in analog and embedded processing technologies, serving diverse automotive, industrial, and communications industries.
The company’s broad product portfolio includes microcontrollers, sensors, and power management solutions.
Notable acquisitions include National Semiconductor in 2011, enhancing TI’s analog capabilities. The company’s merger with Burr-Brown Corporation in 2000 further solidified its position in the market.
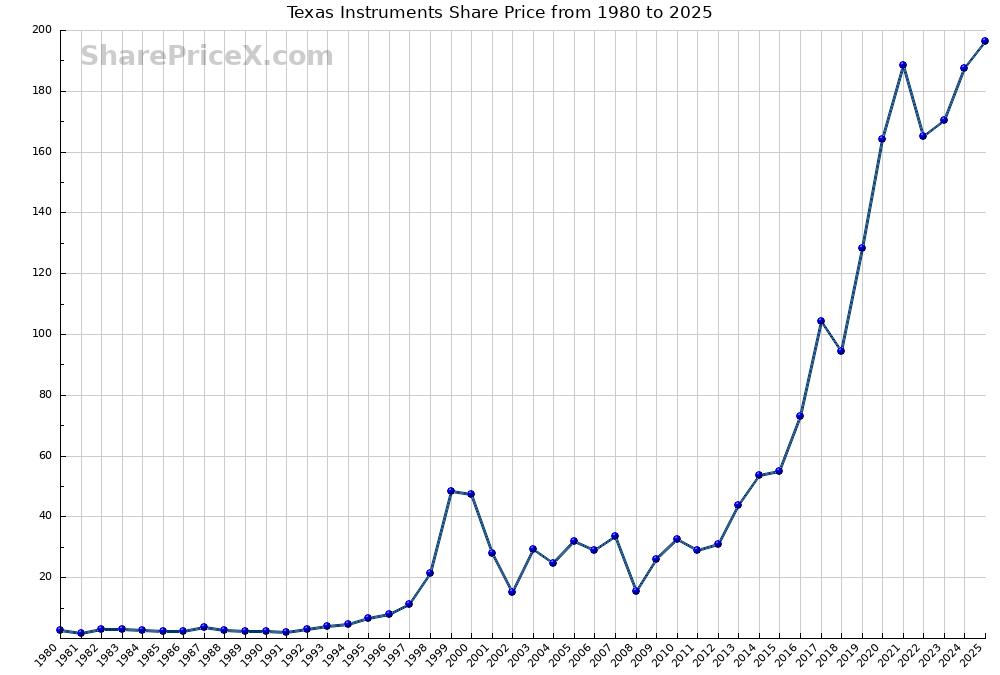
Coming to the share price movement and history of Texas Instruments, in a swift two-year span from September 1998 to March 2000, the stock surged by a staggering 800%, catapulting from $11.57 to $99.78.
Fast forward to March 2009, and patience paid off as the shares, priced at $16.51, multiplied by an impressive 1350% by October 2021, reaching $187.48 – in 12 years timeline.
The journey unfolds a fascinating narrative of both rapid gains and enduring growth, showcasing the diverse timelines and opportunities that make the stock market an engaging prospect for investors.
Texas Instruments Share Price History
| Year | Share Price | Gain / Loss |
|---|---|---|
| 1980 | $ 2.52 | |
| 1981 | $ 1.68 | - 33.3% |
| 1982 | $ 2.80 | + 66.7% |
| 1983 | $ 2.89 | + 3.2% |
| 1984 | $ 2.49 | - 13.8% |
| 1985 | $ 2.20 | - 11.6% |
| 1986 | $ 2.46 | + 11.8% |
| 1987 | $ 3.48 | + 41.5% |
| 1988 | $ 2.56 | - 26.4% |
| 1989 | $ 2.24 | - 12.5% |
| 1990 | $ 2.38 | + 6.2% |
| 1991 | $ 1.92 | - 19.3% |
| 1992 | $ 2.91 | + 51.6% |
| 1993 | $ 3.97 | + 36.4% |
| 1994 | $ 4.68 | + 17.9% |
| 1995 | $ 6.44 | + 37.6% |
| 1996 | $ 7.97 | + 23.8% |
| 1997 | $ 11.25 | + 41.2% |
| 1998 | $ 21.41 | + 90.3% |
| 1999 | $ 48.31 | + 125.6% |
| 2000 | $ 47.38 | - 1.9% |
| 2001 | $ 28.00 | - 40.9% |
| 2002 | $ 15.01 | - 46.4% |
| 2003 | $ 29.38 | + 95.7% |
| 2004 | $ 24.62 | - 16.2% |
| 2005 | $ 32.07 | + 30.3% |
| 2006 | $ 28.80 | - 10.2% |
| 2007 | $ 33.40 | + 16.0% |
| 2008 | $ 15.52 | - 53.5% |
| 2009 | $ 26.06 | + 67.9% |
| 2010 | $ 32.50 | + 24.7% |
| 2011 | $ 29.11 | - 10.4% |
| 2012 | $ 30.89 | + 6.1% |
| 2013 | $ 43.91 | + 42.1% |
| 2014 | $ 53.47 | + 21.8% |
| 2015 | $ 54.81 | + 2.5% |
| 2016 | $ 72.97 | + 33.1% |
| 2017 | $ 104.44 | + 43.1% |
| 2018 | $ 94.50 | - 9.5% |
| 2019 | $ 128.29 | + 35.8% |
| 2020 | $ 164.13 | + 27.9% |
| 2021 | $ 188.47 | + 14.8% |
| 2022 | $ 165.22 | - 12.3% |
| 2023 | $ 170.46 | + 3.2% |
| 2024 | $ 187.51 | + 10.0% |
| 2025 | $ 196.32 | + 4.7% |
Texas Instruments Share Price Chart
 Click here for high resolution Texas Instruments Share Price chart
Texas Instruments Share Returns Calculator
Enter any amount in the 'Investment amount' field and select a year.
The Texas Instruments calculator will tell you the value of your Texas Instruments investment in 2025.
Invested Amount
Investment Year
- During 1980, the share price of Texas Instruments was $ 2.52.
- If you had bought shares worth $ 2500 in 1980, you would have 9921 shares today.
- At the end of 2025, the current value of your shares would be $ 1947619.
Texas Instruments Share Returns Comparison
Invested Amount
Investment Year
Other Investment
Interest Rate