Intel Corporation, founded in 1968 by Robert Noyce and Gordon Moore, is a global leader in semiconductor manufacturing and technology innovation.
Initially focusing on memory chips, Intel ventured to microprocessors in the 1970s, revolutionizing computing with its x86 architecture.
The company’s major acquisitions include purchasing Altera Corporation in 2015 expanding Intel’s presence in programmable logic devices and FPGA technology.
In 2017, Intel acquired Mobileye, a leader in autonomous driving technology, further diversifying its portfolio.
The company is a key player in various sectors, including PCs, data centers, and emerging technologies like Artificial Intelligence (AI) and 5G.
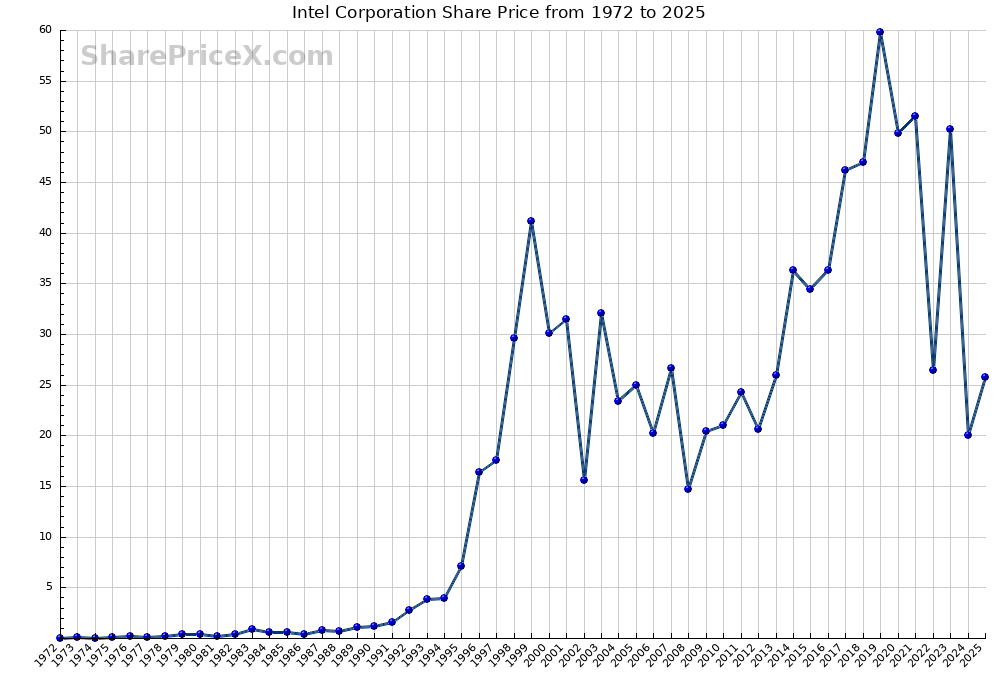
The share price history of Intel endorses how forecasting about the future of a sector or an innovation can benefit an investor.
Anyone who invested in Intel in 1996 would have grown his or her investment ten times, considering it was when internet and technological usage boomed the market.
The share grew nearly 1000% from $8.47 in April 1996 to $74.88 in August 2000. However, it was shaken by the dot com bubble burst. In the next two years, it fell by more than 80%.
In September 2000, the stock crashed 45% in a single month.
Greedy investors who bought Intel shares at the peak of the dot-com bubble and decided to hold on to its share (considering the fact that Intel is a globally renowned quality company) – have yet to recover their price nearly 25 years since the crash.
Intel Share Price History
| Year | Share Price | Gain / Loss |
|---|---|---|
| 1972 | $ 0.04 | |
| 1973 | $ 0.08 | + 100.0% |
| 1974 | $ 0.04 | - 50.0% |
| 1975 | $ 0.13 | + 225.0% |
| 1976 | $ 0.16 | + 23.1% |
| 1977 | $ 0.12 | - 25.0% |
| 1978 | $ 0.18 | + 50.0% |
| 1979 | $ 0.35 | + 94.4% |
| 1980 | $ 0.41 | + 17.1% |
| 1981 | $ 0.23 | - 43.9% |
| 1982 | $ 0.40 | + 73.9% |
| 1983 | $ 0.87 | + 117.5% |
| 1984 | $ 0.58 | - 33.3% |
| 1985 | $ 0.60 | + 3.4% |
| 1986 | $ 0.43 | - 28.3% |
| 1987 | $ 0.82 | + 90.7% |
| 1988 | $ 0.74 | - 9.8% |
| 1989 | $ 1.08 | + 45.9% |
| 1990 | $ 1.20 | + 11.1% |
| 1991 | $ 1.53 | + 27.5% |
| 1992 | $ 2.72 | + 77.8% |
| 1993 | $ 3.88 | + 42.6% |
| 1994 | $ 3.99 | + 2.8% |
| 1995 | $ 7.09 | + 77.7% |
| 1996 | $ 16.37 | + 130.9% |
| 1997 | $ 17.56 | + 7.3% |
| 1998 | $ 29.64 | + 68.8% |
| 1999 | $ 41.16 | + 38.9% |
| 2000 | $ 30.06 | - 27.0% |
| 2001 | $ 31.45 | + 4.6% |
| 2002 | $ 15.57 | - 50.5% |
| 2003 | $ 32.05 | + 105.8% |
| 2004 | $ 23.39 | - 27.0% |
| 2005 | $ 24.96 | + 6.7% |
| 2006 | $ 20.25 | - 18.9% |
| 2007 | $ 26.66 | + 31.7% |
| 2008 | $ 14.66 | - 45.0% |
| 2009 | $ 20.40 | + 39.2% |
| 2010 | $ 21.03 | + 3.1% |
| 2011 | $ 24.25 | + 15.3% |
| 2012 | $ 20.62 | - 15.0% |
| 2013 | $ 25.96 | + 25.9% |
| 2014 | $ 36.29 | + 39.8% |
| 2015 | $ 34.45 | - 5.1% |
| 2016 | $ 36.27 | + 5.3% |
| 2017 | $ 46.16 | + 27.3% |
| 2018 | $ 46.93 | + 1.7% |
| 2019 | $ 59.85 | + 27.5% |
| 2020 | $ 49.82 | - 16.8% |
| 2021 | $ 51.50 | + 3.4% |
| 2022 | $ 26.43 | - 48.7% |
| 2023 | $ 50.25 | + 90.1% |
| 2024 | $ 20.05 | - 60.1% |
| 2025 | $ 25.72 | + 28.3% |
Intel Share Price Chart
 Click here for high resolution Intel Corporation Share Price chart
Intel Share Returns Calculator
Enter any amount in the 'Investment amount' field and select a year.
The Intel Corporation calculator will tell you the value of your Intel Corporation investment in 2025.
Invested Amount
Investment Year
- During 1972, the share price of Intel Corporation was $ 0.04.
- If you had bought shares worth $ 2500 in 1972, you would have 625000 shares today.
- At the end of 2025, the current value of your shares would be $ 16075000.
Intel Share Returns Comparison
Invested Amount
Investment Year
Other Investment
Interest Rate
