City Union Bank is a leading private sector bank with a strong presence in the state of Tamilnadu and South India.
Founded in 1904 in Kumbakonam (Tamilnadu), City Union Bank currently has more than 752 branches.
The bank is focused on Gold loans, Retail Banking and Micro, Small & Medium Enterprises (MSME) banking.
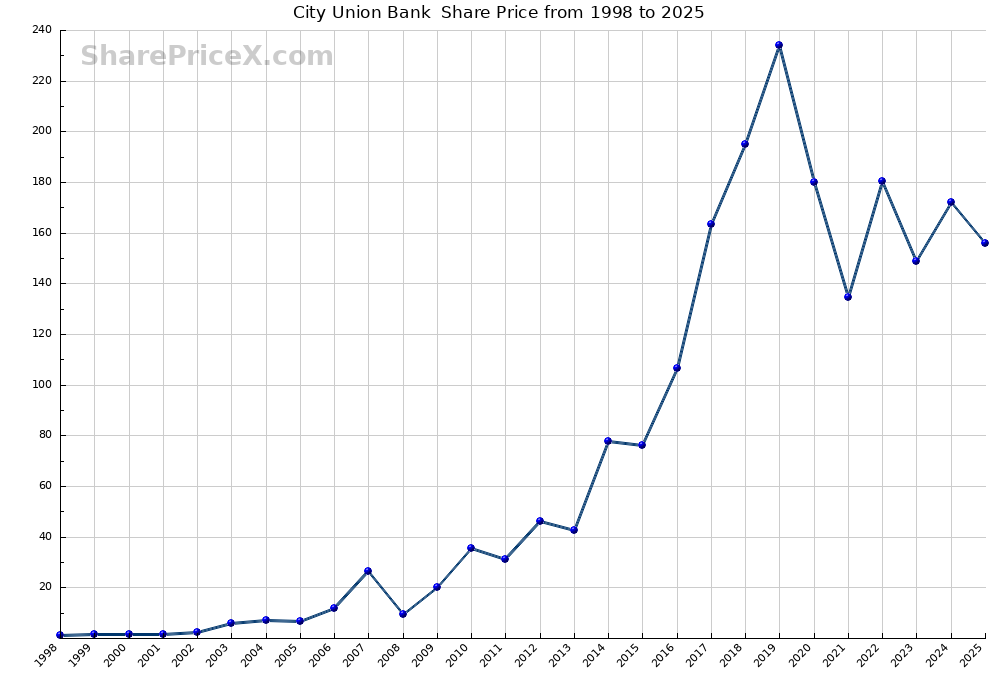
That City Union Bank is a well-managed bank is evident from its long term price chart. It has been a steady rise for the bank – which was listed at the stock exchanges in 1998.
The big falls came in the years when the broader markets crashed – first during the 2008 global financial crisis when almost every listed company fell – the share price of City Union Bank took a beating of more than 75% from the highs.
In 2013, the price fell nearly 40% but recovered quickly.
The testing time for investors came in 2020 when ‘City Union Bank’ not only crashed more than 50% in less than 2 months – but has also struggled to recover and take out its all-time-high of ₹ 249.35 made in January 2020 – just a couple of months before the Covid market crash.
Update (August 2024): City Union Bank has given zero returns to investors who bought the shares in 2017 – 2018 and have held on till now – which is around 6 to 7 years. This is the longest the share price of the bank has stagnated in its listed history. During this period, the bottom line (profits) have more than doubled. The price to earning (PE) current stands at 12.
City Union Bank Share Price History
| Year | Share Price | Gain / Loss |
|---|---|---|
| 1998 | ₹ 1.24 | |
| 1999 | ₹ 1.54 | + 24.2% |
| 2000 | ₹ 1.58 | + 2.6% |
| 2001 | ₹ 1.44 | - 8.9% |
| 2002 | ₹ 2.39 | + 66.0% |
| 2003 | ₹ 5.94 | + 148.5% |
| 2004 | ₹ 6.95 | + 17.0% |
| 2005 | ₹ 6.73 | - 3.2% |
| 2006 | ₹ 11.87 | + 76.4% |
| 2007 | ₹ 26.49 | + 123.2% |
| 2008 | ₹ 9.65 | - 63.6% |
| 2009 | ₹ 20.22 | + 109.5% |
| 2010 | ₹ 35.47 | + 75.4% |
| 2011 | ₹ 31.00 | - 12.6% |
| 2012 | ₹ 46.16 | + 48.9% |
| 2013 | ₹ 42.73 | - 7.4% |
| 2014 | ₹ 77.81 | + 82.1% |
| 2015 | ₹ 76.16 | - 2.1% |
| 2016 | ₹ 106.74 | + 40.2% |
| 2017 | ₹ 163.46 | + 53.1% |
| 2018 | ₹ 195.05 | + 19.3% |
| 2019 | ₹ 233.95 | + 19.9% |
| 2020 | ₹ 180.10 | - 23.0% |
| 2021 | ₹ 134.65 | - 25.2% |
| 2022 | ₹ 180.40 | + 34.0% |
| 2023 | ₹ 149.00 | - 17.4% |
| 2024 | ₹ 172.10 | + 15.5% |
| 2025 | ₹ 155.96 | - 9.4% |
City Union Bank Share Price Chart
 Click here for high resolution City Union Bank Share Price chart
City Union Bank Share Calculator
Enter any amount in the 'Investment amount' field and select a year.
The City Union Bank calculator will tell you the value of your City Union Bank investment in 2025.
Invested Amount
Investment Year
- During 1998, the share price of City Union Bank was ₹ 1.24.
- If you had bought shares worth ₹ 2500 in 1998, you would have 20161 shares today.
- At the end of 2025, the current value of your shares would be ₹ 3144355.
City Union Bank Share Returns
Invested Amount
Investment Year
Other Investment
Interest Rate
